Jasper Ridge allocates each fund's income across its investors every period: management fees, carried interest, preferred return, loss deficit roll-forwards, transfers, all interacting. In fund accounting, a number nobody can explain is a liability. This engine (C# .NET backend, React AG Grid frontend) was built so that every number it produces can explain itself.
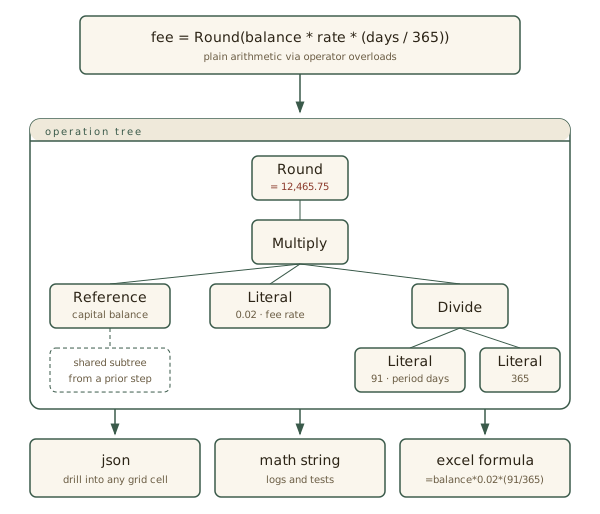
At the core is an operation tracking framework I designed and built. Calculations never produce bare decimals, they build expression trees. I gave the base Operation node overloaded arithmetic operators, so calculation code reads as ordinary math (balance * rate * days, in decimal, never floating point) while each node records its type, its arguments, and a source label naming where the value came from. Implicit conversions to and from decimal mean existing calculation code works on the trees without modification.
Keeping full derivations attached to every value takes some care to stay cheap. I built in logic to collapse nested adds and multiplies into flat argument lists, swap labeled subtrees for shared references instead of duplicating them, and cache each node's result, recomputing only when an argument's value changes (thread-safe, with cycle detection on references). An Uncalculated sentinel I added throws if a step consumes a value before the step that produces it has run.
The same tree can be rendered in many ways: JSON for the frontend, a plain math string for logs and tests, and live Excel formulas with named ranges, so exported workbooks carry the actual calculation in each cell rather than a pasted result. The engine itself is the composable part: allocation logic lives in discrete steps (each declaring what it computes and what it requires) that are assembled into pipelines for each fund.